NIH-funded scientists put socioeconomic data on the map
Friday, June 29, 2018
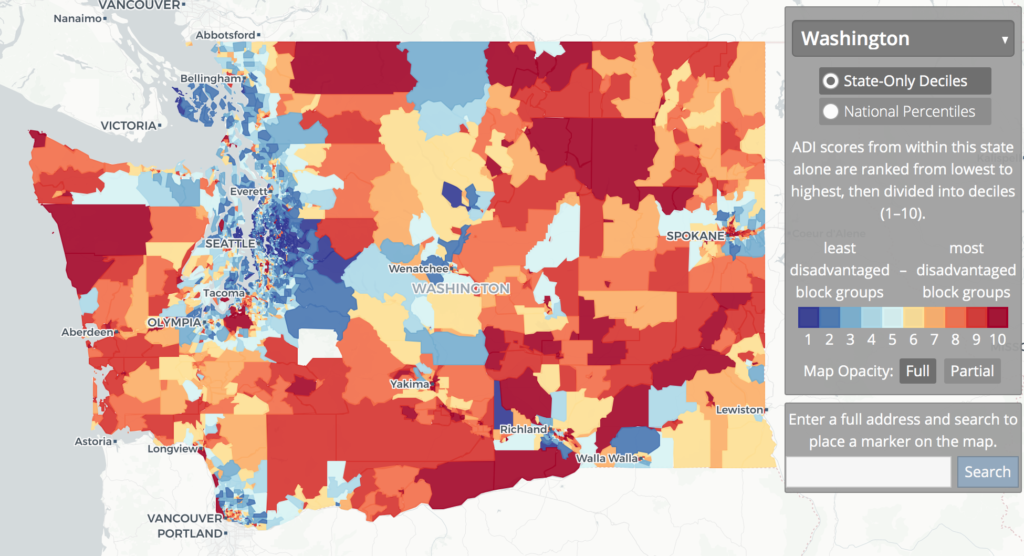
The Neighborhood Atlas, a new tool to help researchers visualize socioeconomic data at the community level is now available. This online platform allows for easily ranking and mapping neighborhoods according to socioeconomic disadvantage.
Seeing a neighborhood’s socioeconomic measures, such as income, education, employment and housing quality, may provide clues to the effects of those factors on overall health, and could inform health resources policy and social interventions.
The Neighborhood Atlas is housed at the University of Wisconsin, and described in a perspective in the June 28 issue of the New England Journal of Medicine. The project is funded by the National Institute on Aging (NIA) and the National Institute on Minority Health and Health Disparities (NIMHD), both part of the National Institutes of Health.
Where someone lives can determine several health-related factors, such as safety, stress and access to food. A person’s neighborhood can influence many conditions, including cardiovascular disease and diabetes, which are disproportionately more common among racial and ethnic minorities and the socioeconomically disadvantaged.
“Socioeconomic disadvantage is one of the fundamental factors that result in health disparities; and understanding those factors is what will lead to development of interventions to reduce disparities,” said Eliseo J. Pérez-Stable, M.D., director of NIMHD. “Having a tool to better understand social factors impacting health disparities is an important step forward to achieving health equity.”
Developed by Amy Kind, M.D., Ph.D., from University of Wisconsin School of Medicine and Public Health, the Neighborhood Atlas uses the “Area Deprivation Index,” which includes 17 measures of education, housing quality and poverty, updated with current American Community Survey data. Users can easily download maps indexed with measures of neighborhood disadvantage — ranging from national down to the local level.
The Neighborhood Atlas is built so that it can be merged with other data sources to foster better understanding of how neighborhood disadvantage impacts health. Dr. Kind noted that the Neighborhood Atlas and its data can be harnessed as a new way to advance disparities-focused research, suggesting it can be used to improve translational, clinical and community research by showing ways to aid design, recruitment, retention and outreach.
Researchers, policy makers and front-line health and social service personnel can use the Neighborhood Atlas to study fundamental social-biological mechanisms of health and disease, develop or study the impact of health policy or better align resources.
“Effectively measuring socioeconomic factors is a key step for conducting rigorous health disparities research related to aging,” said Carl V. Hill, Ph.D., M.P.H. who serves as the director of the NIA Office of Special Populations. “The Neighborhood Atlas enables the application of existing social data to understand the risk factors for many diseases, including Alzheimer’s disease, and provides the field with innovative disease modifiers to study.”
The Neighborhood Atlas is already being used by the U.S. Centers for Medicare and Medicaid Services to inform local operations and targeting strategies for the Everyone with Diabetes Counts program and to predict the increased likelihood of a discharged patient from a disadvantaged neighborhood to need re-hospitalization.
“Living in a disadvantaged neighborhood is associated with many health-related factors including limited access to nutritious food, more safety concerns and greater risk of toxic exposures, such as pollution,” Dr. Kind explained. “Individuals who live in such neighborhoods are more apt to develop certain diseases and to die earlier from those diseases.”


