From the U.S. Centers for Disease Control and Prevention
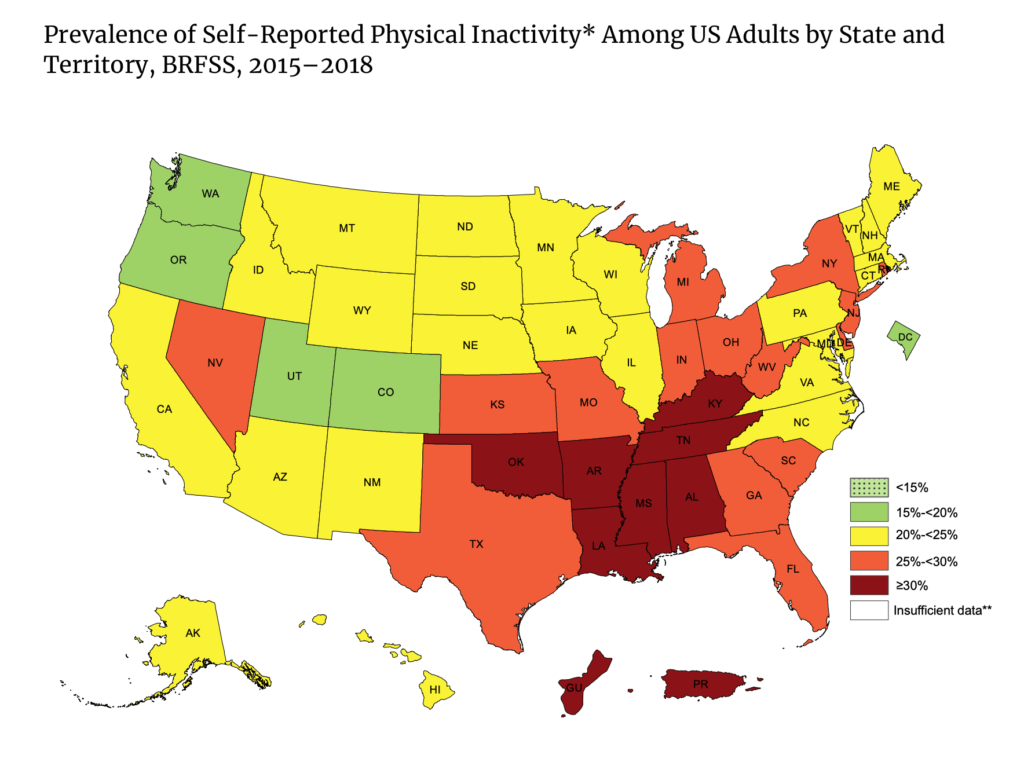
All states and territories had more than 15% of adults who were physically inactive and this estimate ranged from 17.3 to 47.7%, according to new state maps of adult physical inactivity prevalence released today by the Centers for Disease Control and Prevention (CDC).
Physical inactivity for adults is defined as not participating in any leisure-time physical activities over the last month – activities such as running, walking for exercise, or gardening.
State and territory-level estimates of physical inactivity range from 17.3% of people in Colorado to 47.7% in Puerto Rico. In seven states and two territories (Alabama, Arkansas, Kentucky, Louisiana, Mississippi, Oklahoma, Tennessee, Puerto Rico, and Guam), 30% or more of adults were physically inactive. By region, the South had the highest prevalence of physical inactivity (28%), followed by the Northeast (25.6%), Midwest (25%), and the West (20.5%).
Across States and Territories
- All states and territories had more than 15% of adults who were physically inactive.
- In 4 states (Colorado, Washington, Utah, and Oregon) and the District of Columbia, 15% to less than 20% of adults were physically inactive.
- In 24 states, 20% to less than 25% of adults were physically inactive.
- In 15 states, 25% to less than 30% of adults were physically inactive.
- In 7 states (Tennessee, Oklahoma, Louisiana, Alabama, Kentucky, Arkansas, and Mississippi), and 2 US territories (Puerto Rico, and Guam), 30% or more of adults were physically inactive.
- The South (28.0%) had the highest prevalence of physical inactivity, followed by the Northeast (25.6%), Midwest (25.0%), and the West (20.5%).
“Too many adults are inactive, and they may not know how much it affects their health,” said Ruth Petersen, MD, Director of CDC’s Division of Nutrition, Physical Activity, and Obesity. “Being physically active helps you sleep better, feel better and reduce your risk of obesity, heart disease, type 2 diabetes, and some cancers,”
The new maps are based on combined 2015-2018 data from the Behavioral Risk Factor Surveillance System (BRFSS), an on-going state-based telephone interview survey conducted by CDC and state health departments. This is the first time that CDC has created state maps of physical inactivity by race and ethnicity.
The demographics of physical inactivity
The maps point to notable differences in physical inactivity levels by race and ethnicity. Overall, Hispanics had the highest prevalence of self-reported physical inactivity (31.7%), followed by non-Hispanic blacks (30.3%) and non-Hispanic whites (23.4%).
In the majority of locations examined, non-Hispanic blacks and Hispanics had a significantly higher prevalence of inactivity than non-Hispanic whites.
- Five states and Puerto Rico had a physical inactivity prevalence of 30% or higher among non-Hispanic white adults.
- 22 states and Puerto Rico had a physical inactivity prevalence of 30% or higher among Hispanic adults.
- 23 states and the District of Columbia had a physical inactivity prevalence of 30% or higher among non-Hispanic black adults.
Inactivity contributes to 1 in 10 premature deaths in the U.S. Inadequate levels of physical activity are associated with $117 billion in annual healthcare costs.
What more can be done?
CDC is working with communities and partners across the country as part of the Active People, Healthy NationSM initiative, to make it easier, safer, and more convenient for people to be active where they live, learn, work and play. The overall goal of the initiative is to help 27 million Americans become more physically active by 2027 to improve overall health and quality of life and to reduce healthcare costs.
The Physical Activity Guidelines for Americans, 2nd edition, recommends that adults get at least 150 minutes of moderate-intensity physical activity each week. For example, this can be broken into smaller amounts such as 25 minutes every day or 30 minutes/five times a week.
Individuals and families are encouraged to build physical activity into their day by going for a brisk walk or a hike, walking the dog, choosing the stairs instead of the elevator or escalator, parking further away in the parking lot, walking or cycling to run errands, and getting off the bus one stop early and walking the rest of the way. The key is to move more and sit less.
The initiative helps community leaders take advantage of proven strategies to make physical activity safe and enjoyable for people of all ages and abilities. Building active and walkable communities may also help support local economies and create more cohesive communities.
Community leaders can also encourage school and youth physical activity programs, educate, and support families and individuals to be more active. They can create activity-friendly routes to everyday destinations such as home, work, school, and grocery stores.
Together, leaders and community members can work with various populations to design and implement culturally-relevant solutions to reduce disparities in physical inactivity.
To learn more about physical activity, visit https://www.cdc.gov/physicalactivity/index.html.
Maps and data tables are available at www.cdc.gov/physicalactivity/data/inactivity-prevalence-maps/index.html.