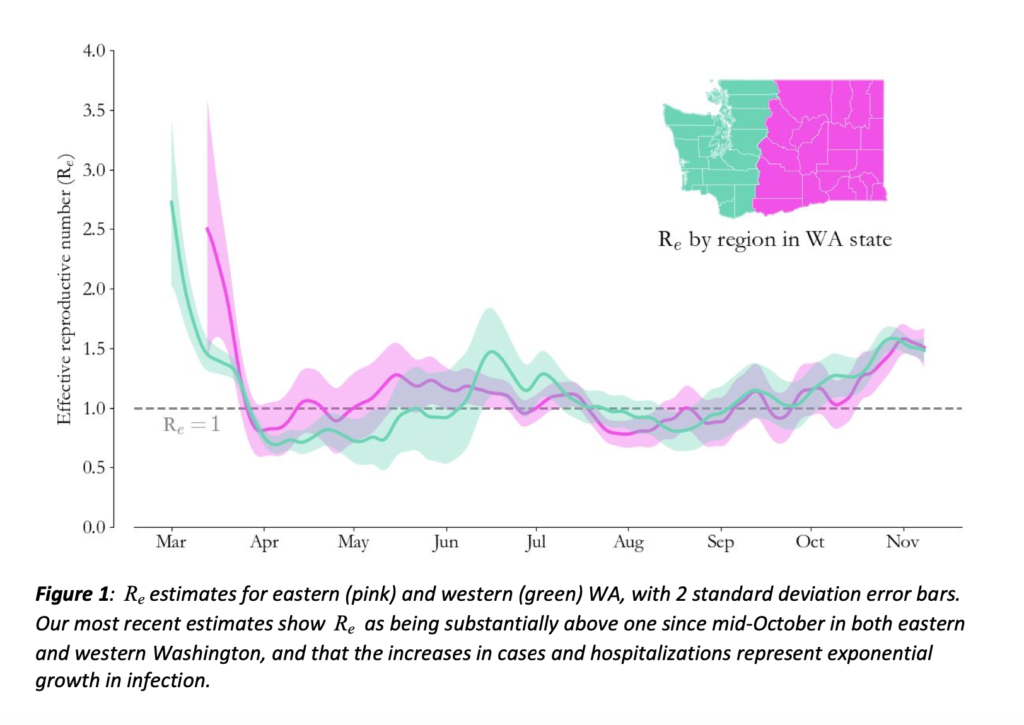
The graph above shows the changes in the epidemics estimated reproductive rate, or Re. R indicates the number of additional infections each new case is likely to cause. If the R is below 1, the epidemic will die out. If the R is above 1, the epidemic will grow. In both eastern (red) and western Washington, the R is well above 1.
From the Washington State Department of Health
Because people’s decisions about whether to get tested or seek healthcare tend to change around holidays, case and hospitalization data over the week of Thanksgiving may not accurately represent true COVID-19 disease activity.
Therefore, data in a report released today by the Washington State Department of Health uses data with a longer than usual lag time and reflects considerable uncertainty in the current situation.
Report findings include:
- COVID-19 continued to spread at a rapid pace throughout the state through mid-November. The best estimates of the reproductive number (how many new people each COVID-19 patient will infect) were 1.44 in western Washington and 1.33 in eastern Washington as of November 15. The goal is a number well below one, which would mean COVID-19 transmission is declining.
- 30 of 39 counties had rates above 200 new cases per 100,000 people prior to Thanksgiving. This indicates that COVID-19 activity is both high and widespread in Washington.
- Cases, hospitalizations and deaths continued to increase sharply since the last situation report. The seven-day rolling average case count in western Washington was more than eight times higher on November 20 than September 12. In eastern Washington, that average increased fivefold over the same period.
- Daily hospitalizations have been on the rise, with hospital admissions reaching peak March levels as of November 20. Eastern Washington saw an almost threefold increase in daily hospital admissions since the start of September. In western Washington, daily hospitalizations increased over four times since the beginning of October.
- Over the month of November, the number of hospital beds occupied by patients with COVID-19 rose sharply across the state. Intensive care unit (ICU) beds occupied by COVID-19 patients show a similar trend, with particularly steep increases in western Washington.
- If hospital admissions continue to grow, we could see hospital occupancy double every two weeks. Hospital occupancy rises faster than admissions, as COVID-19 patients generally stay in the hospital longer than one day. Increasing percentages of the general population with active COVID-19 infections could also result in hospital staff shortages. Washington hospitals have already reduced non-urgent procedures to increase capacity, and ability to create further capacity may be limited. It’s not yet clear whether we are beginning to see a leveling off of hospital admissions or if exponential growth will continue.
- Growth in cases is widely distributed across the state. Among the five largest counties, Clark, Snohomish and Spokane continued to see increases in case counts. Case counts appeared to be flattening in King and Pierce counties. Several medium-sized counties (Benton, Cowlitz, Franklin, Grant, Skagit, Thurston and Yakima) saw steep increases through mid-November, with some recent flattening through November 20. Other mid-size counties such as Kitsap and Whatcom continued to see increases.
- Many small counties are still affected by the surge, with high case counts for their population size. Several of these counties (Adams, Asotin, Clallam, Walla Walla and Whitman) saw recent plateaus but still have high average case counts. Others (Chelan, Kittitas, Lewis, Stevens) continued to show increases. Several counties (Mason, Okanogan, Pacific, Pend Oreille, Columbia, Ferry, Skamania, Wahkiakum) had low overall case numbers but were still seeing increasing case counts. Per capita case rates were particularly high in several southeastern counties.
- The overall percentage of Washington state residents with active COVID-19 infection was higher in November than the peak in late March. The best model-based estimate as of November 20 was 0.52%.
“We are still seeing some alarming trends in our data as we wait to see the full impact of any gatherings that took place over Thanksgiving,” said Secretary of Health John Wiesman. “We must stay the course going into winter holidays to avoid overwhelming our hospitals. While there are reasons to feel hopeful, including our progress toward distributing COVID-19 vaccine, right now we need to continue to make the choices we know will slow transmission. Mask up, gather remotely and stay at home as much as possible.”
DOH partners with the Institute for Disease Modeling, Fred Hutchinson Cancer Research Center, University of Washington and the Microsoft AI for Health program to develop these reports every other week. More COVID-19 data can be found on the DOH data dashboardand in the state’s risk assessment dashboard.


