Two-liter bottle of soda increased 64 percent; price of diet drinks jumped, too
 From the University of Washington School of Public Health and Public Health – Seattle & King County
As expected, Seattleites paid significantly more for their Mountain Dews and Monster Energy Drinks last year. They also paid much more for diet drinks in some stores, even though non-sugary beverages were exempt from the city’s new tax.
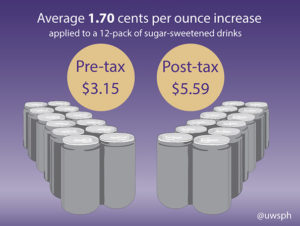
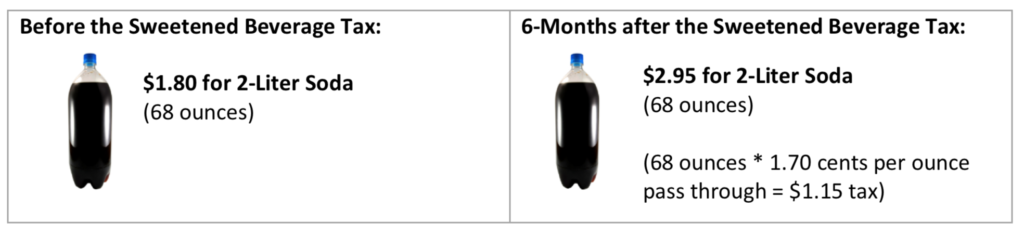
The tax – which charges distributors of sweetened beverages 1.75 cents per ounce – took effect Jan. 1, 2018. Six months later, researchers found the average price of sugary drinks in Seattle was 1.70 cents an ounce higher – amounting to a 97 percent pass-through rate. A typical two-liter bottle of soda jumped from $1.80 to $2.95, or 64 percent. A 12-pack of sweetened drinks went from $3.15 to $5.59, or 77 percent more.
The aim of the tax is to discourage consumption of sugary drinks, which can lead to diabetes and other health risks, while also raising revenue to improve access to healthy food and to fund other nutrition and early learning programs.
“Although we weren’t surprised, it wasn’t guaranteed the tax would be passed on,” said Jessica Jones-Smith, associate professor of health services and epidemiology at the UW School of Public Health. “Distributors could have chosen to have paid the tax themselves, and take it out of their profits. Or they could have spread the cost across other items.”
Jones-Smith is co-leading a wide-ranging study of the effects of the tax along with Nadine Chan, assistant chief of assessment, policy development and evaluation for PHSKC. The research is funded with revenues from the soda tax. The six-month reporton store audits was presented to the City Council Finance and Neighborhoods Committee on Jan. 9.
Researchers are also studying changes in behavior due to the tax, but those findings won’t be available until later this year.
For the six-month store findings, the research team compared prices before and after the tax took effect at more than 400 stores in Seattle and three cities in south King County: Kent, Federal Way and Auburn. A comparison area was needed to account for any other factors that might have affected drink prices.
The researchers looked at soda, sports and energy drinks, teas and coffees, juices, powdered drink mixes, water, milk drinks, fountain drinks and other snack items. They surveyed stores from supermarkets to coffee shops. “This is one of the most comprehensive looks at beverages by a number of different store types,” said Jones-Smith.
Among the key findings:
- Supermarkets and superstores only passed through 86 percent of the increased costs, while smaller grocery stores, drug stores and shops passed on more than 100 percent of costs.
- The average pass-through rate varied, from 62 percent for bottled sugary beverages such as fruit juice to 111 percent for energy drinks. The average pass-through rate for soda was 102 percent.
- Diet and other drinks that were not subject to the soda tax increased significantly (up to 44 percent of the price of the tax in some stores).
Researchers were surprised by the latter finding. “It could be that smaller storeowners increased the price of non-sugary beverages that weren’t subject to the tax because they simply did not know better, or because it was an opportunity to boost profits,” Jones-Smith said. Or, it could be that distributors to these stores increased the price of these beverages as well, according to Jones-Smith. Supermarkets and superstores did not raise the price of these non-taxed beverages.
Stores chose different ways to inform consumers of the tax. Some posted signs and included the tax in the shelf price. Others made no mention of the tax on the price tag, and some assessed the tax at checkout.
Jones-Smith said researchers collected prices again in October and November of 2018, though that data has not yet been analyzed. They plan to survey stores again in fall 2019.
The tax raised nearly $17 million in revenue over the first three quarters of 2018. Jones-Smith said that was much higher than projected because the city conservatively estimated revenues. “The higher projections say nothing about actual consumption patterns,” she added.
Other partners in the soda tax research are Seattle Children’s Research Institute, the UW Center for Public Health Nutrition, the UW School of Social Work and the UW Evans School of Public Policy. Researchers are looking at consumption among low-income children, health outcomes and the impact on small-business revenue.
Separately, Jones-Smith has received funding from the Robert Woods Johnson Foundation to conduct a study of soda taxes, and their regressive nature, in Seattle, Philadelphia and San Francisco. Among other things, the study will estimate revenue benefitting low-income communities compared to the amount of tax paid by low-income households.
Read the FAQs on the six-month store audit.